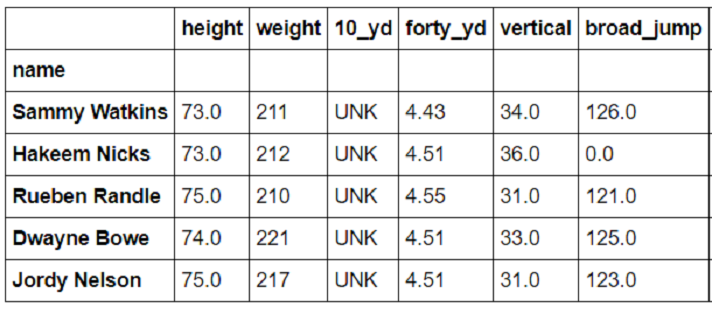
Books, Guides, Home Page, Reviews

Book Reviews

Cookbooks The Food Lab — Winner of the 2016 James Beard Award. An absolute must have for home cooks I’ll say this again and again, The Food Lab is by far the greatest cookbook, and book, that I have ever purchased. 800+ pages of teaching that goes beyond your typical cookbook’s basic list of hit-or-miss… Read More Book Reviews

code, data, Home Page, MLB, Parallel Coordinates, sports, Time Series, Visualization, Visualization Vednesday

Are the Cubs Bad Again? Visualizing MLB Team Records at the All Star Break

With the all star break upon us, I wanted to see how team records at the all star break compare to full season performance. The Chicago Cubs sit below .500 with a 43-45 record (.489) and as a White Sox Fan I get giddy at the prospect of them not doing well again. Last season… Read More Are the Cubs Bad Again? Visualizing MLB Team Records at the All Star Break

code, data, Home Page, python, Time Series, Time Series, Visualization, Visualization Vednesday

Visualization Vednesday: Travel Times Interactive Version

Last week, I wrote about using the Google Maps API to visualize travel times according to when you want to leave by using their “Depart at” feature to simulate traffic. This week I took it a step further and made an interactive version. Go give it a try next time you have to drive somewhere, especially… Read More Visualization Vednesday: Travel Times Interactive Version

algorithms, Analysis, code, data, Home Page, NBA, sports

Replicating Nate Silver’s NBA Elo Algorithm

Before diving into how exactly Nate Silver’s Elo algorithm works I want to tell you a little about Nate Silver. Nate Silver first became famous from his MLB player projection tool PECOTA and managing Baseball Prospectus, a website devoted to baseball “sabermetrics”. Nate became publicly famous for predicting 49/50 states in the 2008 presidential election and was named… Read More Replicating Nate Silver’s NBA Elo Algorithm