code, data, Home Page, python, Time Series, Time Series, Visualization, Visualization Vednesday

Visualization Vednesday: Travel Times Interactive Version

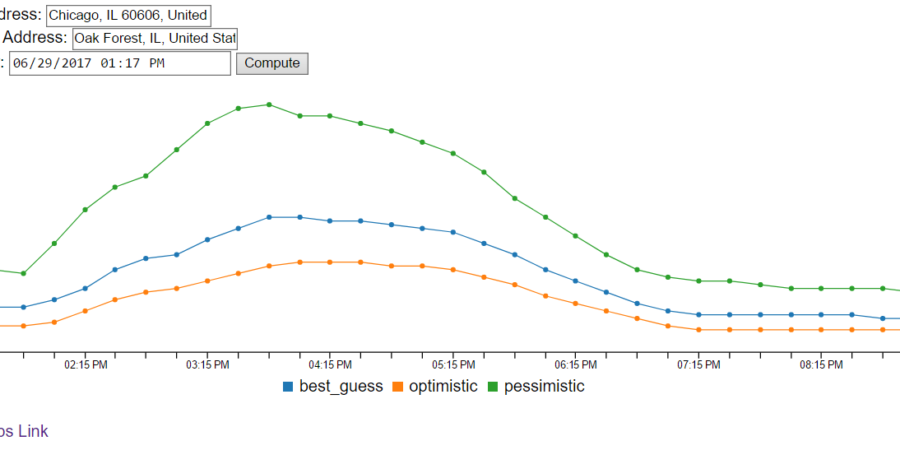
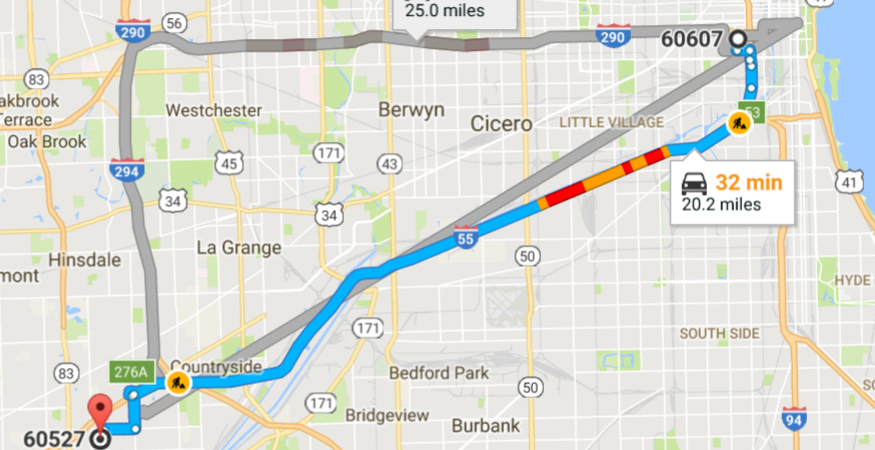
Last week, I wrote about using the Google Maps API to visualize travel times according to when you want to leave by using their “Depart at” feature to simulate traffic. This week I took it a step further and made an interactive version. Go give it a try next time you have to drive somewhere, especially… Read More Visualization Vednesday: Travel Times Interactive Version

code, python, Time Series, Visualization, Visualization Vednesday

Visualization Vednesday: Travel Times

I’m starting a new posting series called “Visualization Vednesday” where I’ll talk about or create a visualization and critique it. For this first post, let’s talk about Google Maps and travel times. Travel Times Problem Yesterday I had to drive home from my parents house to go to dinner with my grandma who had just… Read More Visualization Vednesday: Travel Times

algorithms, Analysis, code, data, Home Page, NBA, sports

Replicating Nate Silver’s NBA Elo Algorithm

Before diving into how exactly Nate Silver’s Elo algorithm works I want to tell you a little about Nate Silver. Nate Silver first became famous from his MLB player projection tool PECOTA and managing Baseball Prospectus, a website devoted to baseball “sabermetrics”. Nate became publicly famous for predicting 49/50 states in the 2008 presidential election and was named… Read More Replicating Nate Silver’s NBA Elo Algorithm